 As the U.S. economy continues to recover from the impact of multiple shocks, there are fresh ones taking shape as a new administration enters the White House. A decade of massive change which kicked off in 2020 still has lots of kick left in it, leaving the wine industry seeking a stable footing.
Business loves certainty. While the comparables to a year earlier were largely negative in 2024, the good news is that they were consistently so. NIQ off-premise scan data for the 52 weeks ended Dec. 28 indicated a drop of 4% versus a year earlier, with the momentum of the declines accelerating from a drop of 3% at the end of 2023. But with consumer behavior continuing to normalize and evolve, the shift was not entirely surprising. During his third-quarter review of shipment data, Gomberg, Fredrikson & Associates partner and editor Jon Moramarco heralded a turnaround in activity this year as accounts began to restock and right-size inventories for a new consumer cycle. “Ideally, by the end of the year retailers [that] have been destocking will have gotten to a point where they can’t reduce inventories anymore,” Moramarco said in his review of wine entering the market, including wholesaler inventory levels. “We will hopefully at least see this start to flatten out if not start to recover a bit in terms of growth.”
Similarly, direct-to-consumer (DtC) shipments showed signs of normalizing though carry-out business from tasting rooms continued to exhibit a slow recovery. Community Benchmark reported total DtC sales through the 550-plus West Coast wineries it tracks down 3.5% in the 11 months through November, though growth of just under 1% was reported in November versus a year earlier. Yet average DtC shipment value skewed higher in WineBusiness Analytics/Sovos ShipCompliant modeling, in line with trends seen prior to the democratization of the channel in 2020. With consumers now fully returned to stores, restaurants and tasting rooms, DtC shipments of $200-plus Cabernet Sauvignon are showing growth. Those receiving the shipments are distinct from the consumers seeking everyday value from $4-plus box wines, which gained 9% by value to $1.6 billion (nearly 9% of the channel) and 7% by volume in the latest 52 weeks. The phenomenon points to ongoing bifurcation in a market seeking both aspirational experiences and value.
On-premise sales as tracked by CGA by NIQ also show wine is struggling, with value down 4% versus a year ago. Positive post-pandemic comparables came to an end last year, despite the resurgence of travel, including so-called “bleisure” trips – those combining business with leisure activities. With the World Travel & Tourism Council (WTTC) projecting global business travel spending reaching $1.5 trillion in 2024, surpassing pre-pandemic levels by 6.2%, lobby bars and surrounding venues should be seeing the benefits, coupled with the expansion of in-office mandates that bring more people to downtown venues for business lunches and after-work socializing (CGA by NIQ notes a marked shift among on-premise patrons to visits earlier in the day rather than later). Restaurant sales are 56% of consumers’ food and beverage spend according to Census Bureau data, an all-time high according to a November analysis by Kalinowski Equity Research.
Yet wine isn’t benefitting, according to the numbers from CGA by NIQ, which indicates that beer was the most resilient of the three major alcohol categories, down just 1%, while spirits were down less than 4% (slightly more resilient than wine). SipSource, which draws on depletions from distributor members of the Wine and Spirits Wholesalers of America, bears this out. Wine was the worst-performing alcohol type in the channel, with depletions from wholesalers down 7.9% in November. “The dining channel continues to face significant challenges for wine and spirits,” SipSource reported. “As consumers increasingly shift toward off-premise purchases and other alternatives, the sector is struggling to recover.”
As inventories adjust to new demand levels, wholesalers are enjoying reduced carrying costs, setting the stage for better comparables as this year unfolds.
A further twist looms as a new president will enter the White House Jan. 20. A flurry of executive orders is expected in the opening hours of the new administration, with ramifications potentially more serious than those signed in 2017. Potential measures include 25% tariffs on incoming goods from Mexico and Canada, a major source of bulk wine for distillation and California wineries’ top export market, as well as higher tariffs on imports from China and other partners.
The new administration has also threatened to crack down on undocumented immigrants, many of whom are integral contributors to the agriculture sector (California employs 16% of the country’s 11.7 million undocumented workers, according to data from the Pew Research Center and Center for Migration Studies of New York). Bluster on the geopolitical front may not have a direct impact on trading relationships, but stands to be an irritant that complicates international relations. While preliminary estimates from bw166 indicate steady growth in packaged imports, which increased 7% in the latest 12 months to $31.5 billion, signs of pre-emptive imports to hedge against the risks have yet to appear. Many believe wine may escape the worst of any new tariff hikes, pointing to the leniency shown following threats of a 100% tariff on French wines in 2019.
Whether wine escapes a rising tide of concern over alcohol consumption is another matter. A pronouncement earlier this month by the surgeon general calling for cancer warnings on alcohol grabbed headlines but merely marked the latest exchange in a running battle. While the news was credited with driving down the market value of publicly traded wine companies, their value has been in long-term decline for a year. The WineBusiness Stock Index (WBIX), a composite metric comprised of 11 publicly traded wine companies weighted by each company’s annual wine revenue, recorded its 52-week high on March 13, with a reading of 124.89. The 52-week low came almost exactly eight months later, on Nov. 12, with a reading of 97.12. While there has been positive volatility in the index since then, the overall trend has been down, with the S&P 500 Index largely trending in the opposite direction. If corporate fortunes have dimmed, multiple factors are at play as the industry retrenches.
The key challenge facing vintners is that the fight for market share in the face of shifting social, cultural, demographic and economic forces shows few signs of ending or even getting easier. A report from Jeffries Equity Research following the release of Constellation Brands Inc.’s third-quarter financials called out a worsening outlook for its wine business and the lack of clarity around the category’s near-term outlook or future recovery. The challenge of gauging consumer demand promises to keep grape growers guessing, potentially hitting pause on new plantings even as the need to renew vineyards in the face of changing environmental and economic factors increased. Allied Grape Growers president Jeff Bitter continues to advocate for the removal of vineyards to facilitate a rightsizing of the industry, and in some cases wineries are backing out of contracts, either giving due notice of cancellations, or refusing shipments.
The wine and grape brokerage Ciatti Company struck a positive note in its year-end report on the global wine market, suggesting that the downturn of the past year has — as in sales — established a new baseline for future performance. “Demographic change, health messaging and proliferating alternative products are not going away in 2025, but the painful supply adjustments the wine industry has been undertaking over the past two years should help ensure it is better placed to meet the incremental, just-in-time buying activity that is becoming the norm,” it reported.
California is not immune, seeing what Ciatti called “incremental” demand for bulk wine and soft pricing that have prompted suppliers to eye overseas markets. While the U.S. remains the world’s largest wine market, it, like the rest of the world, continues to see demand shrink even as total value approaches $110 billion.
While a surge in wineries followed the Baby Boomers’ interest in wine and lifestyle aspirations, a number are now up for sale, signaling a future retrenchment. Declining sales and the need to either scale up distribution through traditional channels or hone on market niches — the latter being ideal for the entrepreneurial brands producing less than 5,000 cases that account for 82% of the nearly 11,500 U.S. wineries – have been the preoccupation to date, but the conditions present many winery operators with limited succession options. While the number of U.S. wineries remained stable through the past four years, it seems a will continue to play out through 2025. The market continues to show good demand for premium vineyard sites, but wineries and their brands face increasing pressure to reinvent themselves for a new generation of consumers.
— Peter Mitham
Number of US Wineries Dips Slightly
The number of wineries in the three West Coast states declined in the past year and winery growth has also slowed in states such as Virginia, Michigan and Georgia that had previously been incubators of dramatic growth.
Data on wineries in all 50 states and Canada comes from the WineBusiness Analytics Winery Database, which is updated regularly throughout the year to ensure the most current and accurate accounting of wineries in North America.
In 2024, the United States was home to 11,450 wineries and that is 1.5% less than the previous year, while the number of wineries in Canada increased 1% to 860.
The No. 1 state by number of wineries, California, saw its share of all U.S. wineries decline to 41% from 43%, as the number of Californian wineries has declined and the number of wineries in other states has grown. Compared to 2023, the number of bonded wineries in California increased by six to 4,060 yet virtual wineries declined by 25% to 667.
WineBusiness Analytics defines a virtual winery as having a distinct brand that is produced at another wine company’s bonded facility. In 2024, there were a total of 1,378 virtual wineries (111 less than last year) accounting for 12% of the 11,450 total American wineries.
The pace of new winery openings has slowed in California allowing the normal rate attrition (new businesses that fail, retirements and acquisitions) to catch up. The difference between new, bonded wineries opening and those ceasing operations remained in balance last year while the change in virtual wineries tipped to negative. In terms of database management, over the past five years the number of wineries added to the database each year has declined at a slightly faster rate than the number of wineries removed from the database. In 2020, the difference between additions and removals, or net winery growth, was 577 but had fallen to -4 by last year.
In the Pacific Northwest, the number of wineries in No. 2 Oregon declined 5% to 846 while No. 3 Washington saw a 2% decline to 840. While the total number of wineries in each state are very similar, Oregon is home to a significantly higher number of virtual wineries than Washington. Of the 846 wineries in Oregon, 248 — or 30% — are virtual while less than 5% of the wineries in Washington are virtual operations.
Among the other top ten states by number of wineries, No. 4 Texas saw the largest increase in wineries gaining 5% over the previous year to 539. The increase further separates the Lone Star state from No. 5 New York, which saw its number of wineries increase by just 1% to 466. New York’s southern neighbor, Pennsylvania, stayed steady at No. 6 with 402 wineries and the number of wineries in No. 7 Virginia also remained nearly the same at 387, which is one less than last year.
No. 8 Ohio enjoyed a 2% increase in wineries to 341 while the number of wineries in No. 9 Michigan declined by one to 253. Rounding out the top ten winery states, North Carolina, stayed at the same position as last year with one less winery for a total of 202 wineries.
Outside of the top ten, some states did see strong growth in wineries and for several that came with an increase in population.
Based on the size of the increase, existing wine infrastructure and population size, the most significant growth occurred in Florida, which saw a 26% increase in wineries to 110. Of those 23 new wineries, 22 are virtual operations. While the growth in Floridian wineries is notable, the state’s share of all U.S. wineries was still just 1% in 2024.
The number of wineries in Canada increased 1% last year to 860, driven entirely by gains in Ontario (home to 292 wineries) as the industry regained momentum following a wave of closures in 2023 driven by a cold snap in January 2022 that slammed wineries trying to resume normal operations following the pandemic.
The growth wasn’t enough to return Ontario to where it was two years ago, when it reported 306 wineries, but it signaled a normalization of operating conditions backed by a government-funded $5 million (Cad.) recovery program.
Most other regions held the course or posted declines as the financial fallout from the pandemic hit home. Government financing that supported businesses during the pandemic became due in early 2024, and many small businesses, including wineries, found themselves short on the cash needed to make payments.
In British Columbia, home to the largest number of wineries, extreme cold in January raised the prospect of a total crop loss in 2024 and little immediate government support. The reality proved not as dire for many wineries, some of whom opted to import U.S. grapes to produce “crafted in B.C.” wines to tide them over. Yet lower visitor numbers due to wildfires in 2023 and restrained spending in 2024 eroded cash flows and led some wineries to close, contributing to a 2% decline in winery numbers. Many others continue to mull their options, quietly seeking buyers (a quarter of wineries in the Okanagan were reported for sale last year) or reorienting their operations. A cost-shared program from the provincial government is offering grape growers up to $23 million (Cad.) to replant with hardier varieties, and government is facing pressure to provide additional supports for an industry that earlier this year pegged losses to vineyards and wineries at $346 million (Cad.).
Declines in B.C. and gains in Ontario have narrowed the gap between the two provinces. B.C. continues to lead Canada in overall numbers, with 38% of wineries, while Ontario ranks second at 34%. Quebec ranks third with 20% of Canada’s wineries. Quebec held the course with 170 wineries. These include both grape wineries, concentrated in the southwest of the province, as well as several fruit wineries and meaderies.
The Prairie provinces of Alberta and Saskatchewan saw relatively significant changes over the past year. A spate of openings in Alberta offset closures in Saskatchewan, contributing to a net increase of three wineries across the two provinces. Alberta’s count rose to 23 while Saskatchewan fell to eight wineries. Population growth in Alberta has supported a variety of business ventures, and the wine sector has benefitted. Saskatchewan is also strong economically, but the small scale of the province’s wine sector — primarily fruit wineries and meaderies — makes it vulnerable to consumer shifts.
The four Atlantic provinces of Newfoundland, Nova Scotia, Prince Edward Island and New Brunswick typically see a small amount of turnover from year to year. The total number of wineries in the region now numbers 40, down by two from a year ago. The three northern territories lost its first and only winery last year with the closure of Whitehorse-based Yukon Wines, and Manitoba is now home to one winery.
— Andrew Adams, Peter Mitham
Prices up for Key AVAs, Varietals
Data gleaned from the Gomberg Fredrikson & Associates Price Service for the monthly Price Analysis Report showed an uptick in total SKUs as well as average FOB prices across all regions and varietals.
Between 2019 and 2023, there was a steady decline in the number of new products added annually to the Price Service. In 2024, 480 new products were added, up nearly 30% compared to last year, and equivalent to the number of new products added in 2022.
Most of these new products were added in the first seven months of 2024; during the first half of the year, an average of 49 new products were added each month. February had the highest number of new products with 61 new products for the month. The monthly number of new products dwindled in the second half of the year, when an average of 26 new products were added each month. This follows similar trends from previous years. Produced each month, the GFA Price Analysis Report features an abundance of pricing data on the most popular varietals, major appellations, key import markets, and alternative packaging.
Although aromatic white wines such as Sauvignon Blanc have outperformed the wider market, Chardonnay remains the dominant white. The number of Chardonnay SKUs from California increased 7% over last year while the number of Sauvignon Blanc SKUs was also up 7%. Chardonnay accounted for 59% of all the white wine SKUs from California while Sauvignon Blanc held a 20% share.
Cabernet Sauvignon accounted for 30% of the red wine SKUs from California in January and Paso Robles led growth in SKU count with a 16% increase over January 2023. The Russian River Valley retains its spot as the top producer of Pinot Noir with 417 SKUs, up 9% versus last year, but the Willamette Valley of Oregon and California also were the source of comparable numbers of Pinot Noir SKUs.
The comparable strength of sparkling wine sales likely drove the increase in SKUs from Italy, California and Champagne, which is the source of the largest number of sparkling wine SKUs and has the highest average FOB price of any wine region. California and Provence were the leading sources of rosé wine SKUs but as the popularity of this wine type has plateaued so too has growth in SKUs and average FOB prices.
— Sarah Brown
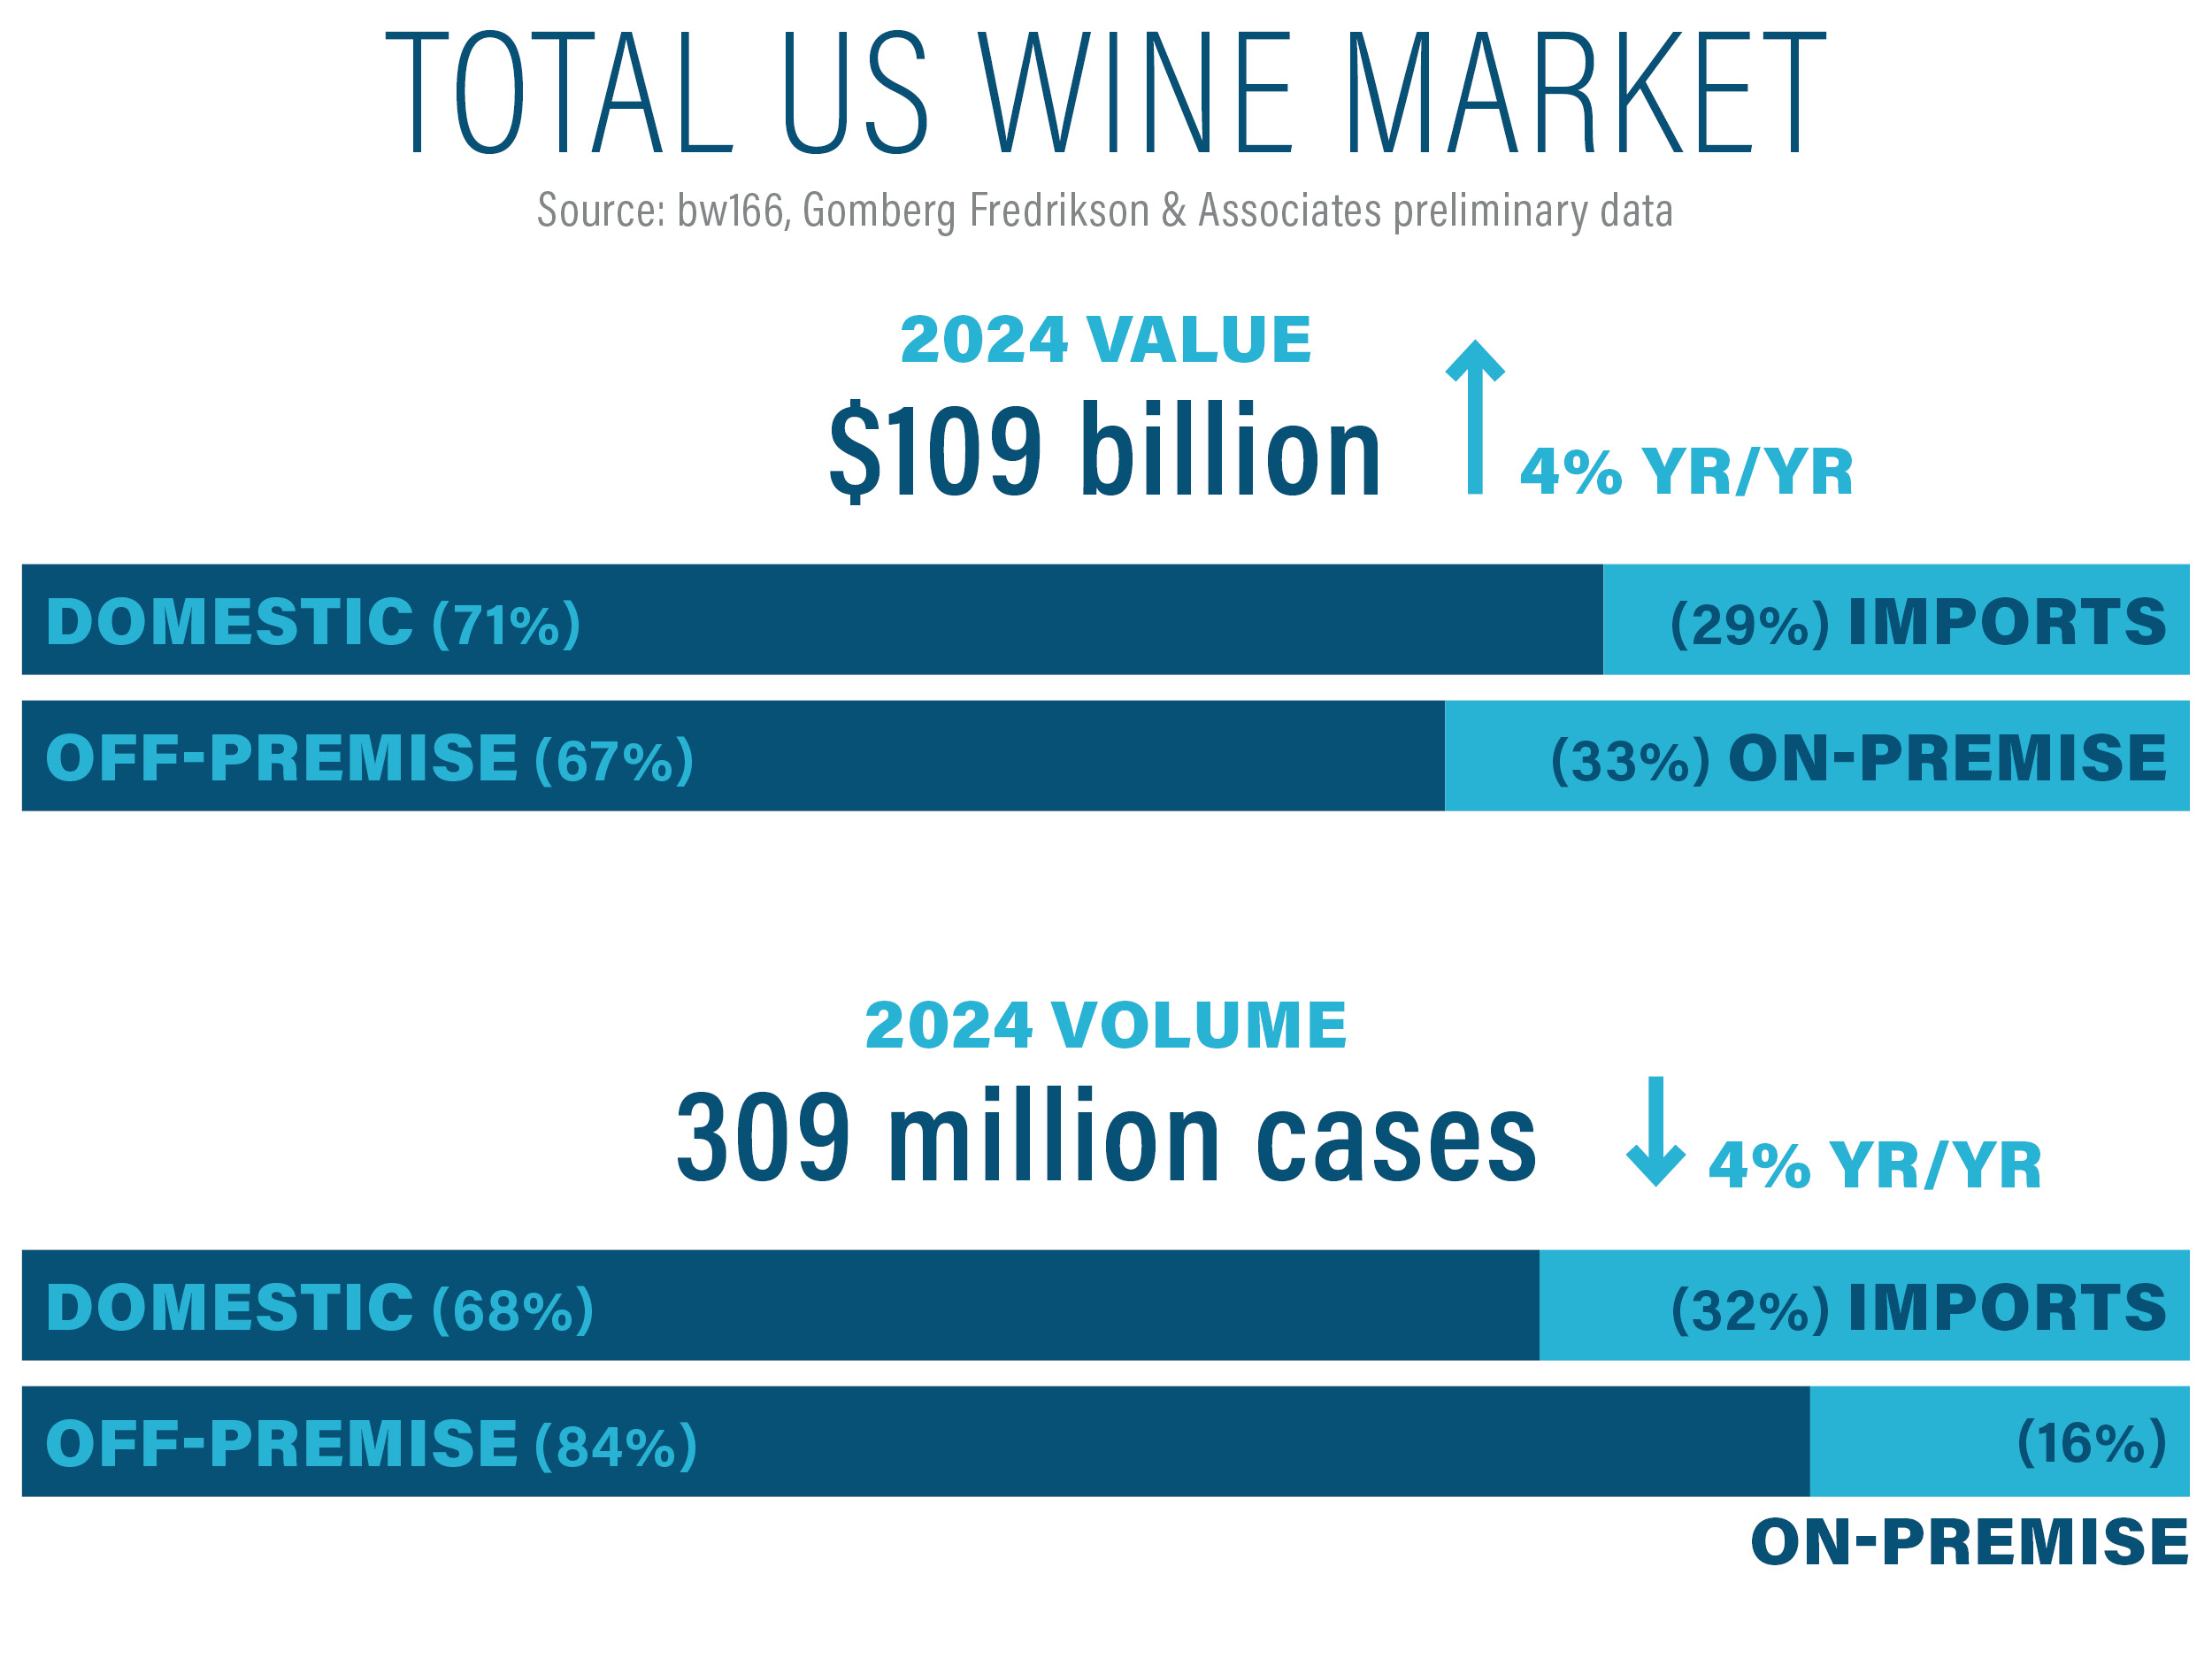
Industry Metrics: Total Value Gains 4%
Domestic Wine Sales Value 12 months ended December 2024
- +4% U.S. wine sales including bulk imports, bw166
Other Industry Metrics for December 2024 (versus December 2023) data:
- -7% off-premise sales value, NIQ channels
- -4% on-premise sales (52 weeks ended Sept. 7), CGA by NIQ
- +13% DtC shipment value, WineBusiness Analytics/Sovos ShipCompliant
- -28% Winery Job Index, Winejobs.com
The total wine market in the U.S. grew nearly 4% in value during the 12 months ended December to $109.2 billion. Preliminary figures showed that packaged imports were the fastest growing segment, with growth of more than 7% to $31.5 billion. On-premise spending increased 4% to $36.4 billion, outpacing growth of nearly 4% in the off-premise channel, where spending totaled $72.8 billion. Overall case volumes in the latest 12 months declined 4%, as normalization versus a year earlier continued.
Sales of domestic table and sparkling wines through NIQ off-premise outlets totaled nearly $1.4 billion in the four weeks ended Dec. 28, down 7% versus a year ago. Volume in the period declined 7% to 11 million cases. The figures reflected an expanded scope of reporting from outlets across 31 states plus Washington, D.C. The shift represents a 1.8x increase in sales coverage for wine and improved statistical projections. In the latest 52 weeks, table wine value fell nearly 4% to $12.4 billion while sparkling wine value fell 8% to $826 million. Sales volume for sparkling wines fell nearly 9% to 6 million 9L cases in the latest 52 weeks, with table wine volume down 6% to 113 million 9L cases.
Quality and value remained a key decision factor in purchasing wine in 2024. In the latest 52 weeks, sales value for wine in glass across all price points suffered declines, with the exception of the $20-$24.99 price point, which remained relatively unchanged compared to last year at $934 million. Sales value for wines in glass sub-$10.99 totaled $5.6 billion, down 7%, while higher price tiers showed lesser declines.
Sales volume for wines in glass sub-$10.99 also had the greatest declines across all price points; wines in glass priced less than $3.99 totaled 4.72 million 9L cases, down 13% versus last year. Higher price points again remained in line with sales volume from 2023; the sales volume for the $15-$19.99 and $25-plus price tiers both declined 1% and the $20-$24.99 price tier once again remained unchanged compared to last year. The lack of decline in both sales value and volume for this price tier could suggest that this is the “sweet spot” where consumers feel comfortable spending on a bottle of wine.
On-premise spending in the 52 weeks ended Nov. 2 fell nearly 4% versus a year ago to $13.9 billion, CGA by NIQ reported. All categories saw declines, led by a nearly 12% drop in pink wine sales to $559 million. White wines remained resilient, with a nearly 4% drop to sales of slightly less than $8 billion. Still wines fell 4% to $10.8 billion, while sparkling wines fell 8% to $3 billion. Domestic wines fell nearly 5% to $8.6 billion while imports fell nearly 4% to $5.3 billion.
DtC shipment value rose 13% versus a year ago to $341 million in December, according to WineBusiness Analytics/Sovos ShipCompliant. Volume was even with last year at 582,193 cases. The increase followed declines in October and November and reflected a quirk in the calendar that provided a longer shipping window prior to the Christmas-New Year’s week than last year offered. Shipment value was on par with 2021, while volume was closer to 2018 levels.
Total shipment value for the latest 12 months was down 5% versus a year ago to $3.9 billion, while channel volume was down 10% to 6.4 million cases. Wineries outside the key West Coast growing areas saw activity hold the course in 2024, with both shipment value and volume down 1% to $224 million on 781,579 cases (a volume greater than Oregon and Washington combined). Napa County wineries continued to lead the channel with shipments valued at $1.8 billion (down 6% versus a year ago) while those in Sonoma County held the leadership position on volume, with 1.8 million 9L cases shipped, down 12% from a year ago. Yet the volume drop handed Sonoma the largest increase in average bottle price, rising 10% to $36.50 — still significantly below the channel average of $51.20 (up 6% from a year ago). The difference in the Sonoma average versus the channel suggests wineries there have room for bottle price growth as the direct channel continues to be defined by more expensive bottles.
Winejobs.com’s Winery Job Index was down 28% versus a year ago in December to 173. The index finished 2024 where it has remained all year: less than in 2023. With a value of 181, the sales and marketing subindex was the largest component of the Winery Job Index in December and declined just 9% compared to last year. The winemaking subindex was down nearly 47% to 148 versus last year and the DtC subindex fell by 20% to 171.
According to the Bureau of Labor Statistics, the U.S. job market added 256,000 jobs in December, surpassing the number of jobs added in November and October combined. In total, the economy added approximately 2.2 million jobs in 2024, which is on par with job creation from 2017 through 2019. The unemployment rate dipped slightly from 4.2% to 4.1% in the final month of the year.
Searches for sparkling wine on wine-searcher accounted for 7.9% of all U.S. searches in December and this share was 7% less compared to last year. Of sparkling wine searches, nearly 74% were for wines from Champagne and this share was essentially unchanged compared to last year. The share of searches for many of the other top producing sparkling wine regions, including California, remained unchanged or declined versus last year, with the exception of some European regions which hold relatively small shares of overall searches. Trentino-Alto Adige and Oregon, both of which hold less than 1% of sparkling searches, were up 63% and 39%, respectively.
Dessert wine searches were similarly down 7% and made up less than 4% of U.S. wine searches in December. Searches for Douro and Bordeaux, which split 44% of U.S. searches for dessert wine, were both down 7%. Like searches for sparkling, searches for specific regions remained relatively unchanged compared to last year. Searches for dessert wines from Loire, which accounted for nearly 3% of dessert wine searches, were up more than 20% while searches for dessert wines from Languedoc-Roussillon, which accounted for 2% of dessert wine searches, were up nearly 74%
Average click price for all wines was down 4%. Searches for sparkling wine (-10%), dessert wine (-11%) and Riesling (-10%) suffered the greatest declines. Meanwhile, average click price for Rosé wines and Sauvignon Blanc were up by 13% and 14%, respectively.
Upcoming Events
Direct to Consumer Wine Symposium: Jan. 21-23
Celebrating its 18th year as the leading conference focused wholly on the direct-to-consumer market, the symposium is presented by, and as a fundraiser for, Free the Grapes! This year’s conference will take place at the Hyatt Regency Monterey in Monterey, Calif. dtcwinesymposium.com
Unified Wine & Grape Symposium: Jan. 28-30
The largest wine and grape conference and trade show in North America taking place at the SAFE Credit Union Convention Center in Sacramento, Calif. unifiedsymposium.org
WSWA Access Live: Feb. 3-6
Access LIVE conference in Denver, Colo., brings together all three tiers of the industry to collectively connect, innovate, grow and address key industry challenges. accesslive.wswa.org
Oregon Wine Symposium: Feb. 3-4
Hosted live at the Oregon Convention Center in Portland, Ore., the symposium features practical sessions with actionable takeaways on key industry topics as well as a trade show and multiple networking opportunities. oregonwinesymposium.com
WineVit: Feb. 10-12
Hosted by the Washington Winegrowers at the Three Rivers Convention Center in Kennewick, Wash. wawinegrowers.org
Premier Napa Valley: Feb. 19-22
Trade auction to support the Napa Valley Vintners. premierenapavalley.com
Midwest Wine and Grape Summit: Feb. 24-25
Hosted by the Illinois Grape Growers and Vintners Alliance, the Missouri Wine and Grape Board and the Missouri Vintners Association, the inaugural summit will take place in Carterville, Ill. illinoiswine.com
Central Coast Insights: March 12
The leading economic forecast and financial conference, Central Coast Insights, is held in Paso Robles, Calif., and features regional and national wine industry leaders who are experts in winemaking, grape-growing, sales, M&A deals and talent acquisition. centralcoastinsights.com
WiVi Central Coast: March 13
WiVi Central Coast, is the premier wine and viticulture symposium and trade show in Central California. Held in Paso Robles, Calif., WiVi boasts 45,000-square-feet of exhibit space with nearly 200 exhibits and hundreds of new products, product demonstrations, educational seminars and networking opportunities for winemakers, grape growers, winery owners and managers. wivicentralcoast.com
Eastern Winery Exposition: March 25-27
As the largest industry event east of the West Coast, EWE is designed to provide Eastern U.S. and Canadian wineries, vineyards and suppliers with an easily accessible, affordable and professional meeting place, trade show and Eastern-focused conference in Lancaster, Pa. easternwineryexposition.com
Wine Retailer Summit: May 7-8
A networking and informational conference of independent fine wine retailers organized in San Francisco, Calif., by the National Association Wine Retailers (NAWR). The conference will cover political, legal, shipping, marketing, technology, and industry issues. nawr.org
International Bulk Wine and Spirits Show: July 29-30
Hosted at the South San Francisco Conference Center, the International Bulk Wine and Spirits Show offers sessions and networking for players in the bulk wine and spirits industry. ibwsshow.com/en/